Humidity Storm
Yesterday on the way home from the UW, I stopped at the local supermarket to buy some food and some cold beer.
But I could hardly see into the refrigerated cases: they were completely covered with a thick veneer of condensation.
I mean a LOT of water (see below).

Why was there so much water vapor in the air?
Normally, the initial stages of major heat waves are associated with downslope flow on the Cascades that is relatively dry.
Then I got a few emails from folks in northwest Washington complaining about the humidity.
OK, I had to figure out what was going on.
The best measure of the absolute amount of water vapor in the air....the "stickiness" and discomfort.. is the dew point temperature.
This is the temperature to which you have to cool air down to for saturation (100% relative humidity). For dry air you have to cool it down a lot to get it to saturation.
So dry air has low dew point temperatures. And moist air has high dew point temperatures. Here in western Washington, the dew point temperatures in summer are generally in the lower 50s. Even lower dew points are typical in dry eastern Washington.
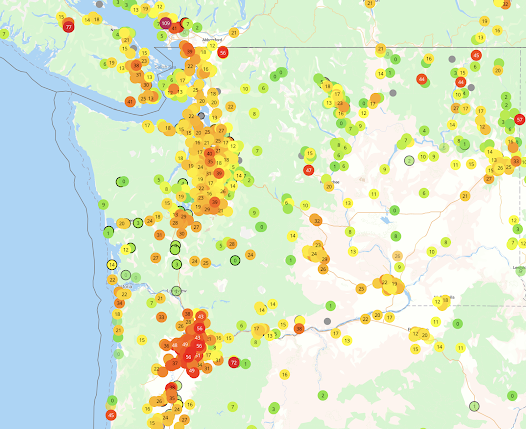
To figure out the situation, I plotted up the dew points today around the region and was shocked (see below)
For example, the dew points around 11 AM this morning were 70F in Bellingham and around Vancouver. And well into the 60s around Puget Sound.
These are very high dew points for our region. The only time they were higher in recent memory was during the big heat wave last June. Very warm temperatures can evaporate a lot of water and cause high dew points, but our temperatures today, although warm, were not even close to last summer.
The highest dew points were over the relatively cool northwest WA/Vancouver area.
Interesting, high-resolution numerical weather prediction models, like the UW-WRF model, predicted the high dew points over NW Washington (see below for 11 AM Tuesday, light green colors indicate higher dewpoints.)
First, this heat wave did not have strong flow from the east like many heat wave periods. Such flow would be drying, with an origin east of the Cascades and lower humidity from the warmth associated with sinking air on the western slopes of that mountain range.
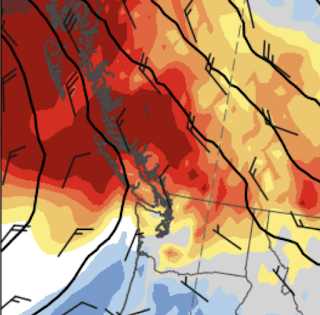
But then I looked at the atmospheric moisture coming off the Pacific: a plume of very high moisture values was circling around the high pressure offshore. This is shown by the moisture and pressures/heights near 10,000 ft on Sunday as shown below (red and grey indicated high moisture values). You can see the moisture moving around the high on the north side.
This moisture rotated around the high and moved into Northwest Washington (see the 10,000 ft moisture Tuesday morning, below)
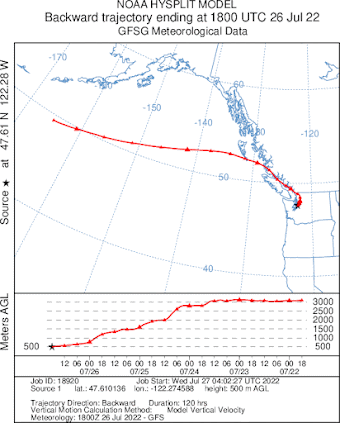
The air that reached the surface near Bellinghan and Seattle originate northwest of those cities and descended out of the moisture patch down to the surface, warming as it descended. We can see that from the 3-D path of air reaching Seattle this morning (see below). The top panel shows the spatial path and the bottom one shows the elevation of the air (later to the left). The air was descending rapidly on July 24-25.
In summary, a plume of moisture from deep over the Pacific rotated around the high and then descended to the surface. And during the final few hours, it was over the moist western side of our region.
Well, after exploring this situation, I decided that I deserved some ice cream to help me cool off a bit.
I open my freezer....and I was stunned by what I saw....something that is associated with moist air being chilled to below freezing. Life has its frustrations....


Comments
Post a Comment